Work Tembo (acquired by Hoonuit)
Sub-30-second charts over millions of combinations
A data explorer for the Texas Education Agency, with a hard performance budget and no option to pregenerate.
- Client
- Tembo (acquired by Hoonuit)
- Role
- Backend Lead
- Period
- 2018 to 2019
- Focus
- Development, Performance
- < 30 s chart generation budget
- Millions possible chart combinations
- 6 to 10 s hidden cost I found and removed
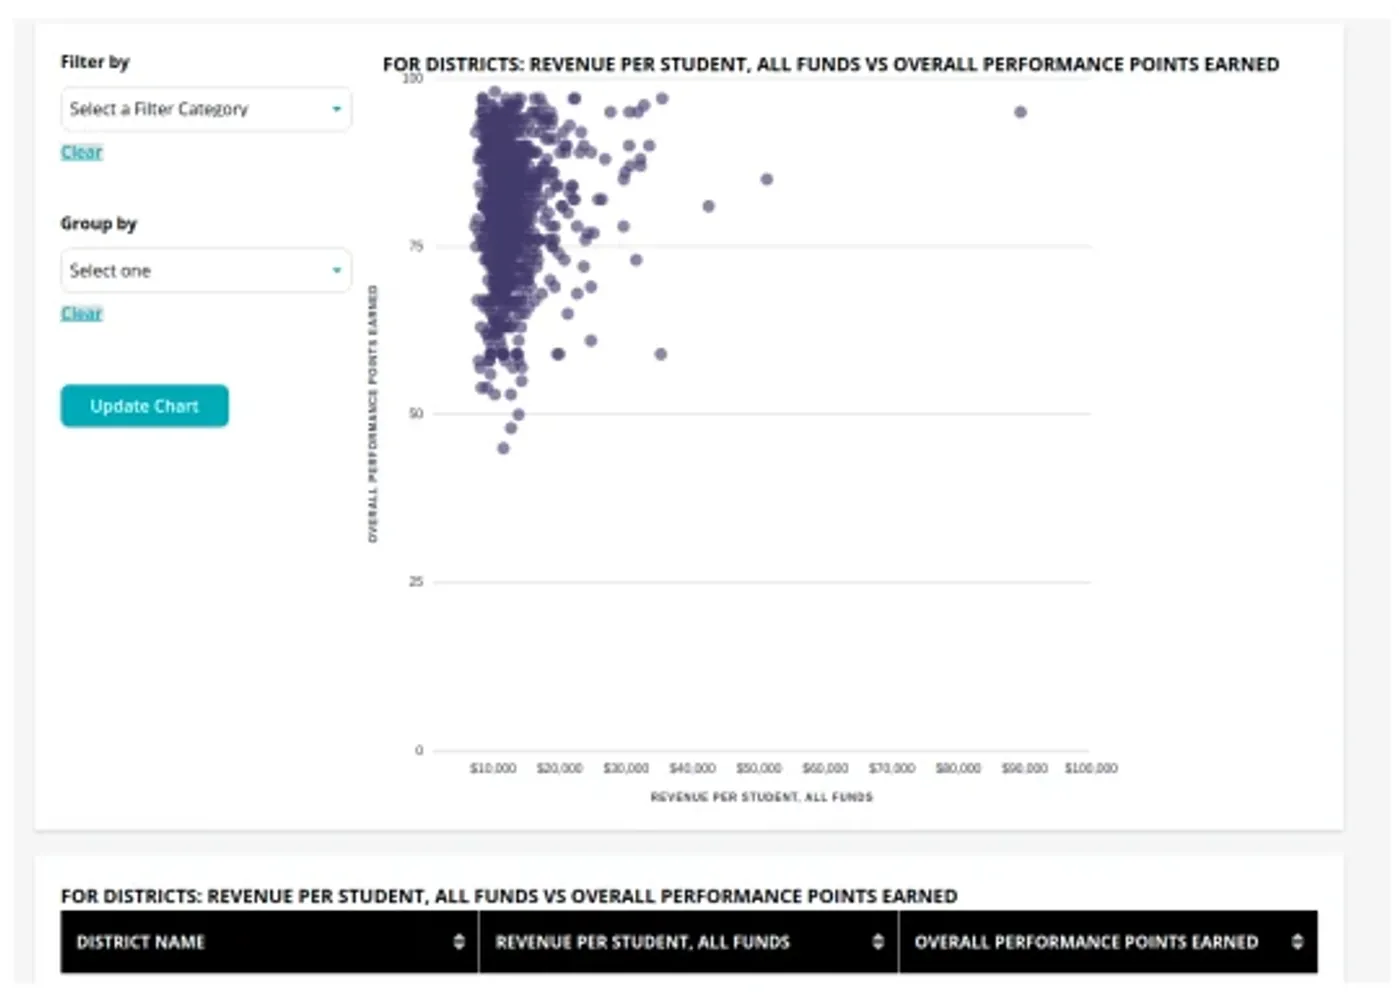
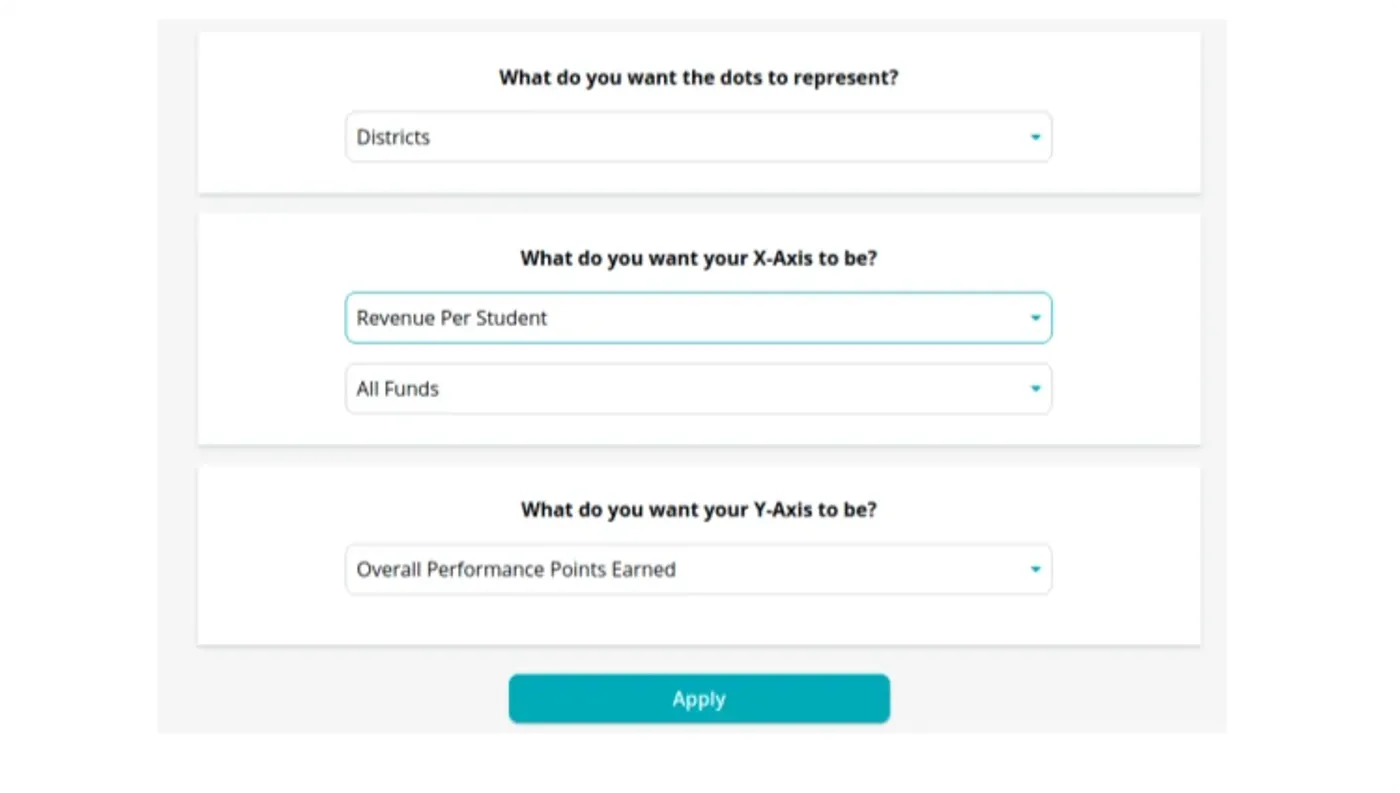
The Texas Education Agency commissioned a data explorer with two requirements that fought each other: every chart had to render in under 30 seconds, and the whole thing had to work on a phone.
The project split into a Vue frontend and a Python backend. I worked with the lead frontend engineer on where to draw that line, and I built the backend.
Why we did not pregenerate
With our dimensions, filters and grouping facets there were millions of possible charts, and we expected parents, educators and politicians to look at a small handful of high profile ones. Precomputing the whole space would have been enormous effort spent mostly on charts nobody would open. So the charts are generated on demand and the work went into making generation fast.
Finding the real bottleneck
I used django-cacheops and fast-numbers to speed up the Python layer, and
tightened Postgres autovacuum. Redis was the obvious cache, but profiling showed
6 to 10 seconds per request disappearing into serializing and deserializing chart
data to and from it. That is the kind of cost that never shows up in a query plan.
I added an in-process memory cache, controllable from a separate microservice, to
take that hit off the hot path.
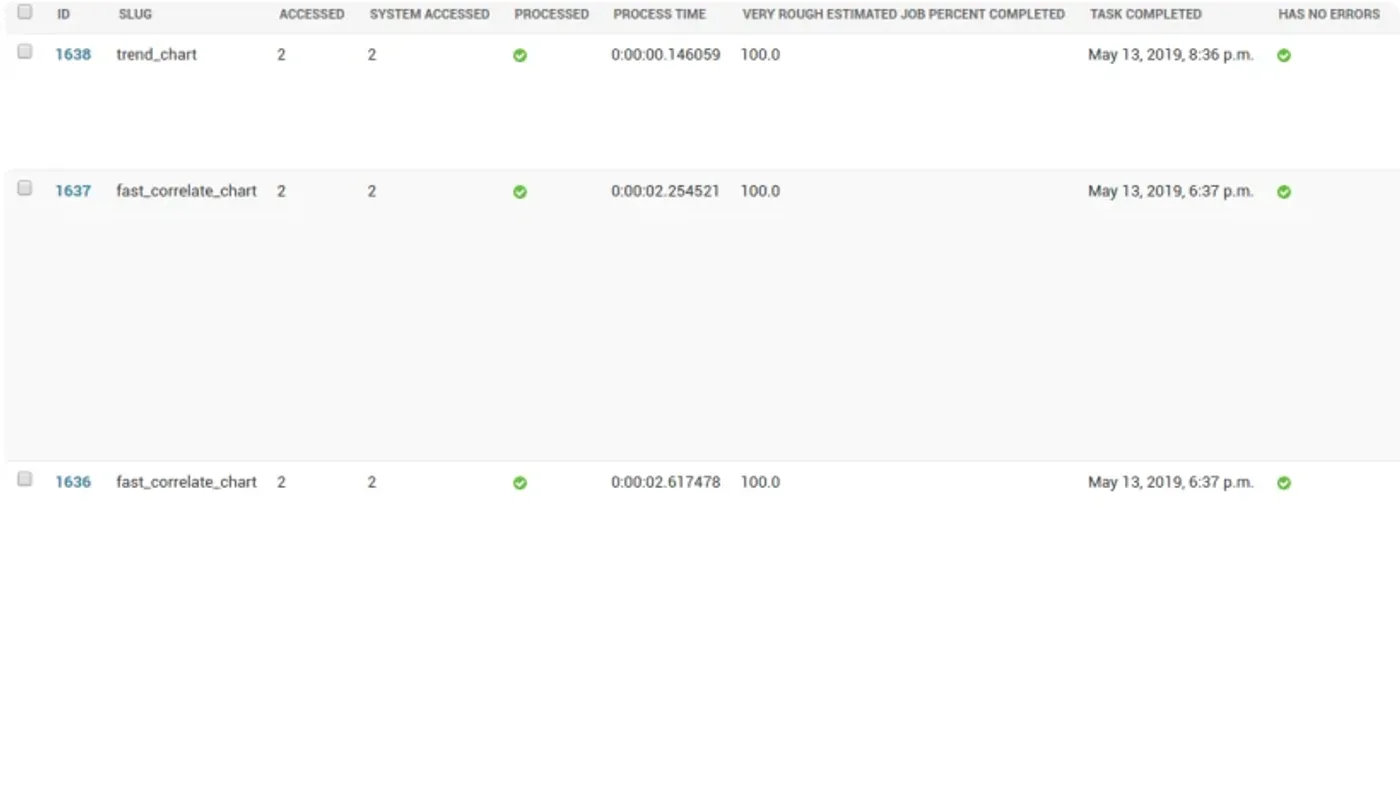
I modeled the school facts dimensionally, built the API first, and stood up a Highcharts prototype early to surface business requirement problems to stakeholders while they were still cheap to fix. I also built a Django admin panel so we could watch which charts were running slow in production.
Postscript. TEA has since moved to the SAS Viya platform. It is slower, it is not mobile friendly, and it is a worse experience for the people using it.
Screens